Studying the Throughput of a Commercial Lens
Brendan Hill, May 2015
Introduction
In our lab, we have used commercial lenses to gather light for past astronomical studies. Due to certain effects and trends, we are interested in whether the throughput of these commercially-available lenses may be dependent on the lens’ focal length. Here, we examine a Nikon lens under controlled dark room conditions to determine whether changing its focal length changes the results of the indicated flux given by IRAF packages.
Setup and Methods
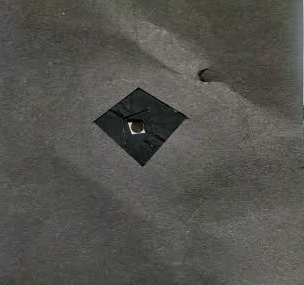
We mounted a Nikon Nikkor 135mm lens onto a CCD and fixed the CCD to a post on our lab table. On the other end of the table, about 2m away, we used an integrating sphere to provide a light source. A small laser was mounted to feed red light into the sphere, and we covered the output hole of the sphere with a 10-micron pinhole. The camera lens was angled toward the pinhole. Images of the setup are below.
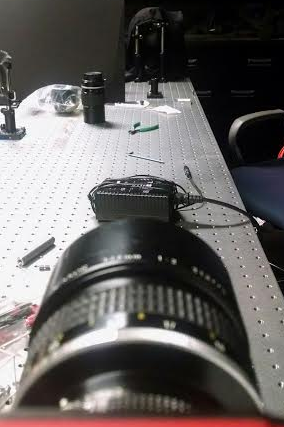
The setup covered the entire length of the lab bench, in order to make the light source as point-like as possible. We rejected the use of mirrors to provide additional optical path length in order to avoid introducing any extra unknowns into our experiments (i.e. reflective coefficients). The lens we were using had continuous focal length control and eight discrete steps in f/#: 2, 2.8, 4, 5.6, 8, 11, 16, and 22. We selected our experimental focal lengths from the numbers marked on the focal length selection dial. The focal lengths were approximately centered on 2m.
We used CCDOps as our software package to collect raw data. In all cases, the CCD was cooled to 0 C before data taking begun. Each image we used was dark-subtracted using IRAF before it was analyzed. We sought to achieve maximal signal-to-noise ratios in each of the images we took. In order to do this, varying the f/# between sets of exposures meant that we had to also vary exposure times to compensate for this. Our exposure times for each f/# were chosen so that no image was close to saturating the CCD, but the image of the pinhole still appeared brightly against the background.
In changing the exposure time, we also ran into another problem: the fluctuations in the light source were causing large variations in our flux measurements for our shorter exposure times (1-2 s). To solve this problem, we took at least 40s of total exposure for each combination of f/# and focal length that we studied. This smoothed out our data enough so that we were confident that the light source was smooth enough over this time period to give us good results.
Image analysis was completed using IRAF with the help of DS9. Using the packages in IRAF, we were able to extract data for flux and FWHM for each image, and average over several images at the same f/# and focal length to obtain an estimate for the mean of these values, as well as a standard error bar for these values.
Using these methods, we rejected any combination of f/# and focal length which produced a FWHM of greater than 7 pixels. In our analysis of flux, aperture radius was kept greater than three times the FWHM for each image (to reduce any clipping of flux).
Results
We examined the dependence of FWHM on f/# – the results are:
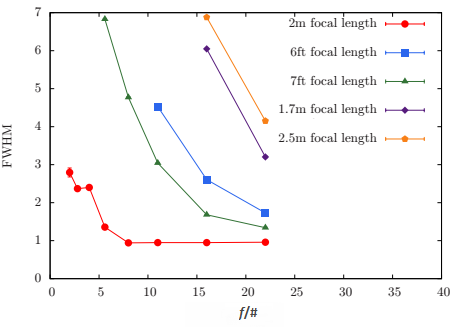
As expected, a smaller aperture leads to a smaller FWHM, with a different curve for each focal length. There are clear fluctuations in the data, and the curves also level off at a point. The levelling off can be attributed to the limitations of the IRAF software to measure FWHM below a value of ~0.9. When the image was in focus, IRAF recognized it as a point source of light, which is one of the things we were looking for.
We also plotted Flux vs. f/# on both a linear and log-log scale. We would expect that a smaller aperture area would allow a proportionally smaller amount of flux to reach the CCD – the results are below:
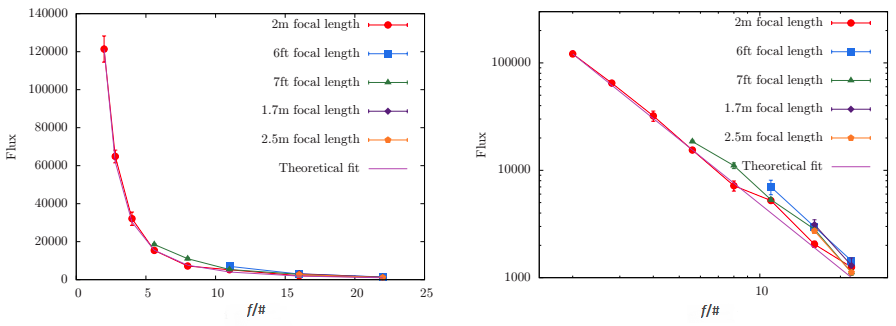
The deviations are somewhat easier to see on the log-log plot. The 2m focal length (in focus) appears to agree nicely with what we expected to see, while the other focal lengths appear to diverge from the theoretical calculations.
To show this further, we took the residuals at each point and divided by the calculated (expected) values at each point. The results:
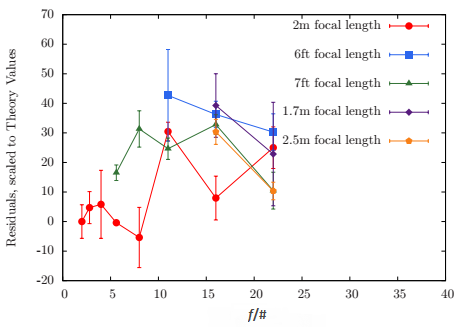
This plot shows two possible trends. First, flux appears to slightly increase relative to expected amounts for higher f/#. Second, flux appears to decrease relative to expected amounts for more focused images.
Conclusion
Given our data, it appears that there is some link between the measured throughput of this lens and its focal length. For truly conclusive results, we would need more data, and we would need a smoother light source to study the exact dependence of throughput on focal length. It would also be useful to thoroughly study IRAF’s photometry packages to determine how they react to different levels of focus in images of objects that are known to have identical flux. However, there are deviations that are statistically significant within our data, and it is likely that measured throughput here is not entirely independent of focal length.