OSI DFPS Spectrograph

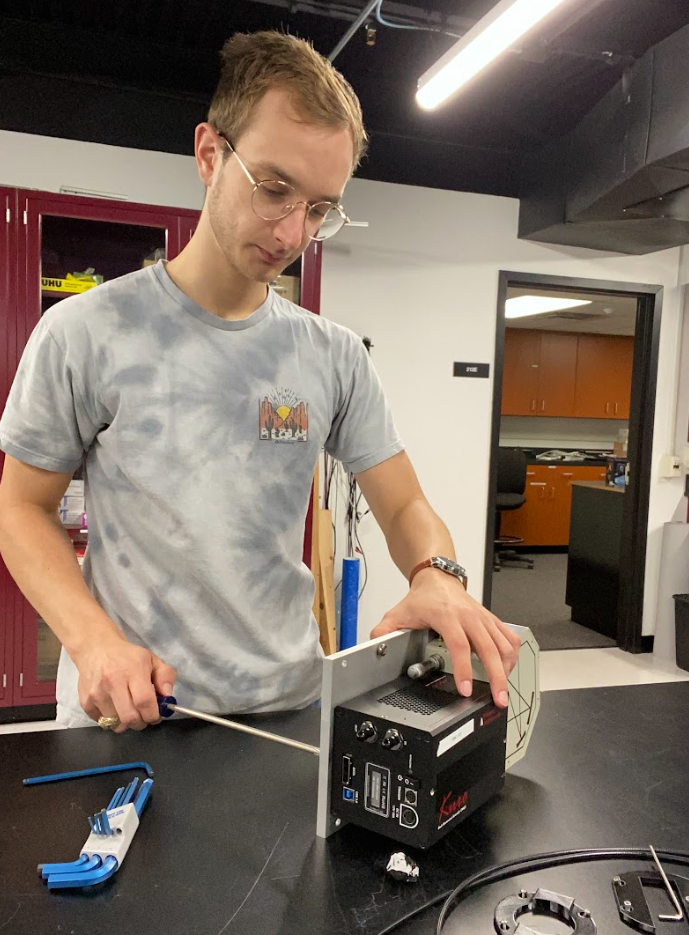
Undergraduate project: Mason Jelken
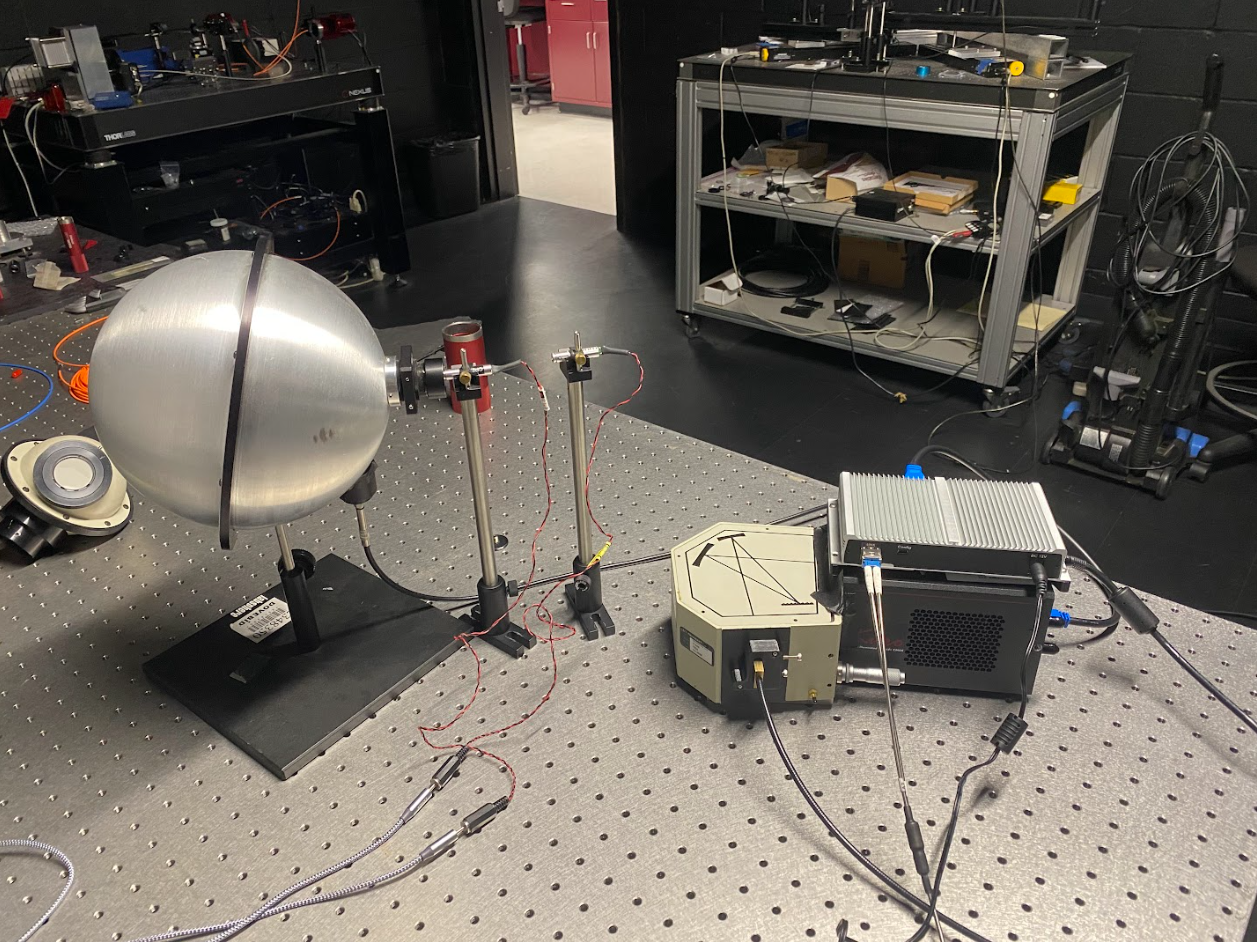
Our lab is working with Open Source Instruments (OSI) to test their Direct Fiber Positioning System (DFPS) prototype at McDonald Observatory. We repurposed an ORIEL MS125J spectrograph and Teledyne Kuro sCMOS detector to collect spectra for up to four objects at a time, one spectra for each fiber of the DFPS prototype. The readout of the detector is then sent through a custom data pipeline to extract the unique spectra from each object. This data can be used to determine the 4 objects’ relative elemental abundances via observations of emission and absorption features that will give insight on the formation and behavior of these celestial bodies.
Hardware
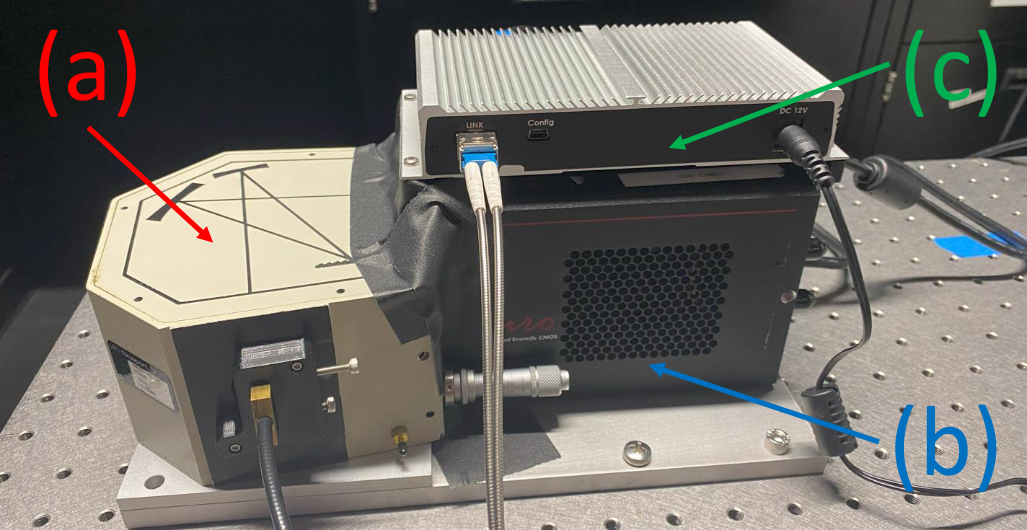
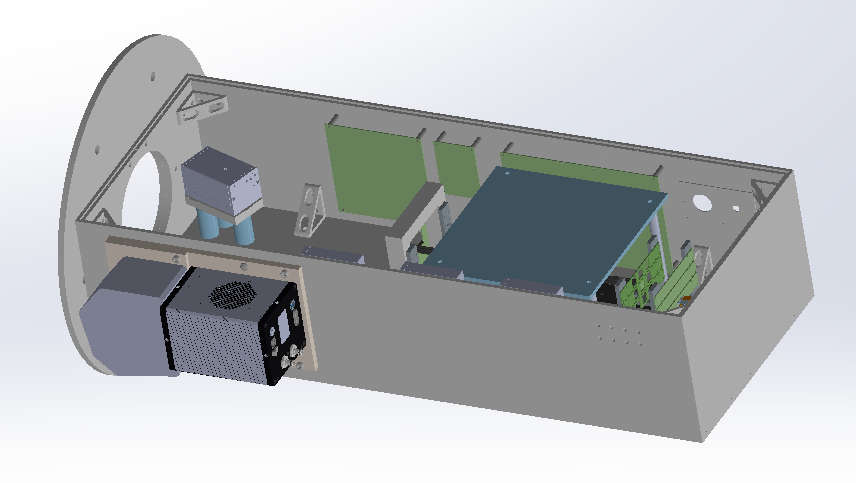
There are three main hardware components for this system. The spectrograph to spread the light into its spectra, the detector to collect the light information from the spectrograph, and a fiber-optic USB relay device. The spectrograph is an ORIEL MS125J spectrograph, a compact system that has an adjustment screw to change the bounds of the spectra. The original optics were made to observe only one source at a time, so a cylindrical lens is added to reduce effects of the inherent astigmatism in the images. The detector is a KURO 2048B sCMOS detector from Teledyne Princeton Instruments. The fiber-optic USB relay device allows for control and data collection at a greater distance. These components are joined via two aluminum plates designed and fabricated in the lab that also mounts this system to the OSI DFPS.
Software
The KURO 2048B detector utilized for data collection was also used on ETSI, so we repurposed the ETSI control code to control the detector. Additional capabilities such as viewing single exposures was added with basic data reduction methods; i.e., accounting for dark current. To accurately obtain information about the spectra observed, a relation between the position of an emission line on the detector, the wavelength of the line, and the setting on the spectrograph’s micrometer had to be found. This was done by observing the readings of a 650nm and a 780nm laser at a range of settings for the micrometer.
The pixel-wavelength relation was found by linear interpolation in the placement of the two peaks and a function for this transformation was found. Through fine adjustments of the micrometer the wavelength-micrometer relation was also found. This relation was extrapolated to test with a 450nm laser with great success. A program for obtaining the desired setting on the micrometer adjustment screw was also constructed. This allows the user to input the wavelength that they wish to be in the center of the detector, and they are given the setting that best fits this wavelength.
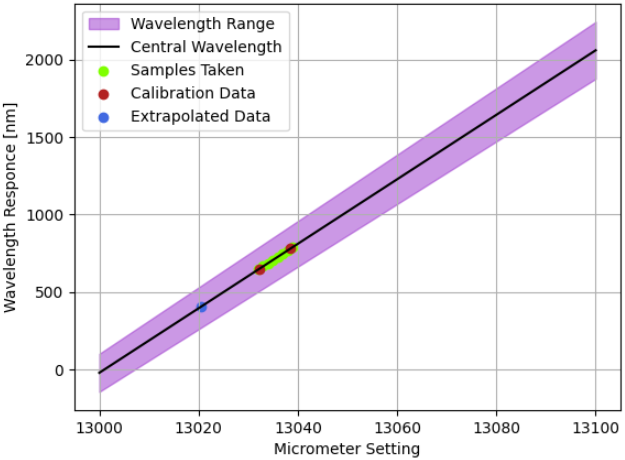
Image Correction
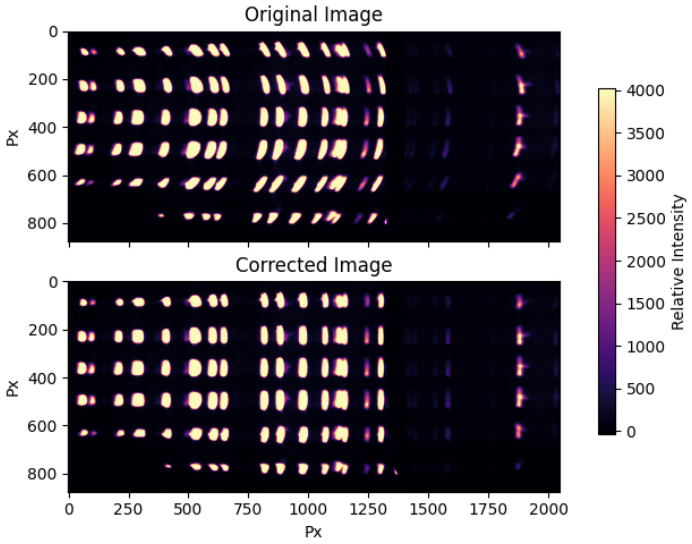
The ORIEL MS125J has an astigmatism in the optics as a tradeoff for its compact design, which is not an issue when viewing a single source. However, we need to view four sources. A cylindrical lens partially corrected this, but post-processing software corrections were needed to further improve image quality. Due to the unique properties of this system, a new correction algorithm had to be constructed for the best results. The correction results in an increase of spectral resolution by approximately 25%. A HgAr lamp was used for testing the correction software.
Publications
Design and Fabrication of the Back-End for a Prototype Multi-Object Spectrograph, Mason D. Jelken, Luke M. Schmidt, 2024 AggieSTAAR and Texas A&M LAUNCH poster session